4 Why is Spatial Data Special?
4.1 Spatial Data
So far, we’ve looked at regression models without thinking much about where data comes from in space. But in many real-world problems, location has to be considered.
This is where spatial regression comes in.
Spatial regression focuses on understanding the link between spatial patterns (what we observe in space) and underlying processes (what causes those patterns).
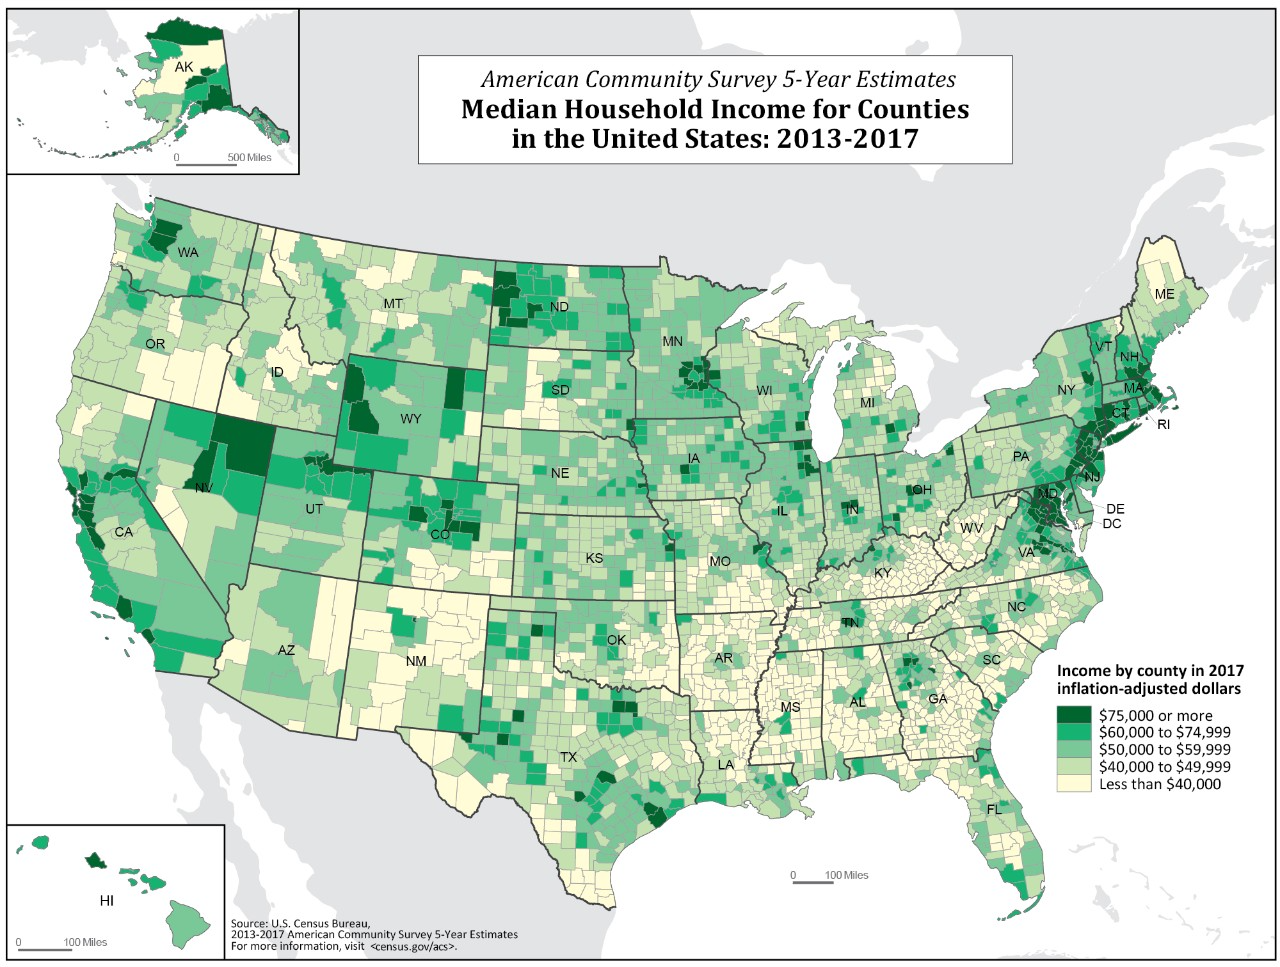
Map of household income by county in the US 2013-2017. From the US Census Bureau (https://www.census.gov/library/visualizations/2018/comm/acs-5yr-income-all-counties.html)
4.2 Spatial vs Non-Spatial Thinking
Data can be treated in two main ways:
4.2.1 Explicit spatial data
Here, location is the main focus of the analysis. Where things happen matters directly.
- Example: mapping flood risk, crime locations, etc.
4.2.2 Implicit spatial data
Here, location is not the main variable, but it still influences results.
- Example: income, education,etc.
4.3 How We Represent Space
We represent spatial data in different ways depending on the problem:
4.3.1 Point data
- Represents a single location
- Has no area or shape
- Example: GPS locations, sampling sites
4.3.2 Line data
- Has length but no area
- Represents connections or movement
- Example: rivers, roads, shipping routes
- Often studied using ‘network theory’
4.3.3 Polygon data
- Represents areas with boundaries
- Example: countries, counties, watersheds
4.3.4 Field data (continuous space)
- A value exists at every point in space
- Think heatmaps
- Example:
- temperature fields
- elevation
- atmospheric data
- temperature fields
4.4 Scale Matters
One of the most important ideas in spatial science is that results depend on the scale at which you measure them.
This leads to several key challenges.
4.4.1 The Multiple Representation Problem
The same phenomenon can look very different depending on how it is represented:
- Raster vs vector data
- Coarse vs fine resolution
- Aggregated vs detailed views
There is often no single “correct” scale—only different representations.
4.4.2 Uncertain Boundaries
Spatial features are often not clean or exact:
- Coastlines change with tides
- Ecosystems blend gradually into each other
- People migrate
So boundaries can be:
- fuzzy
- porous
- moving
- context-dependent
4.4.3 The Locational Fallacy
A common mistake is assuming everything has a fixed spatial location.
But not all processes are spatially anchored:
- Mugging has a clear location
- Fraud may not have a meaningful spatial point
4.4.4 Fractals and the “Coastline Paradox”
Some spatial features get more complex as you measure them more closely.
A classic example is the coastline paradox:
- The closer you zoom in, the longer the coastline becomes
- This happens because you capture more detail at smaller scales
- There is no single “true” length
- This idea is linked to fractal geometry, where: complexity increases as scale decreases
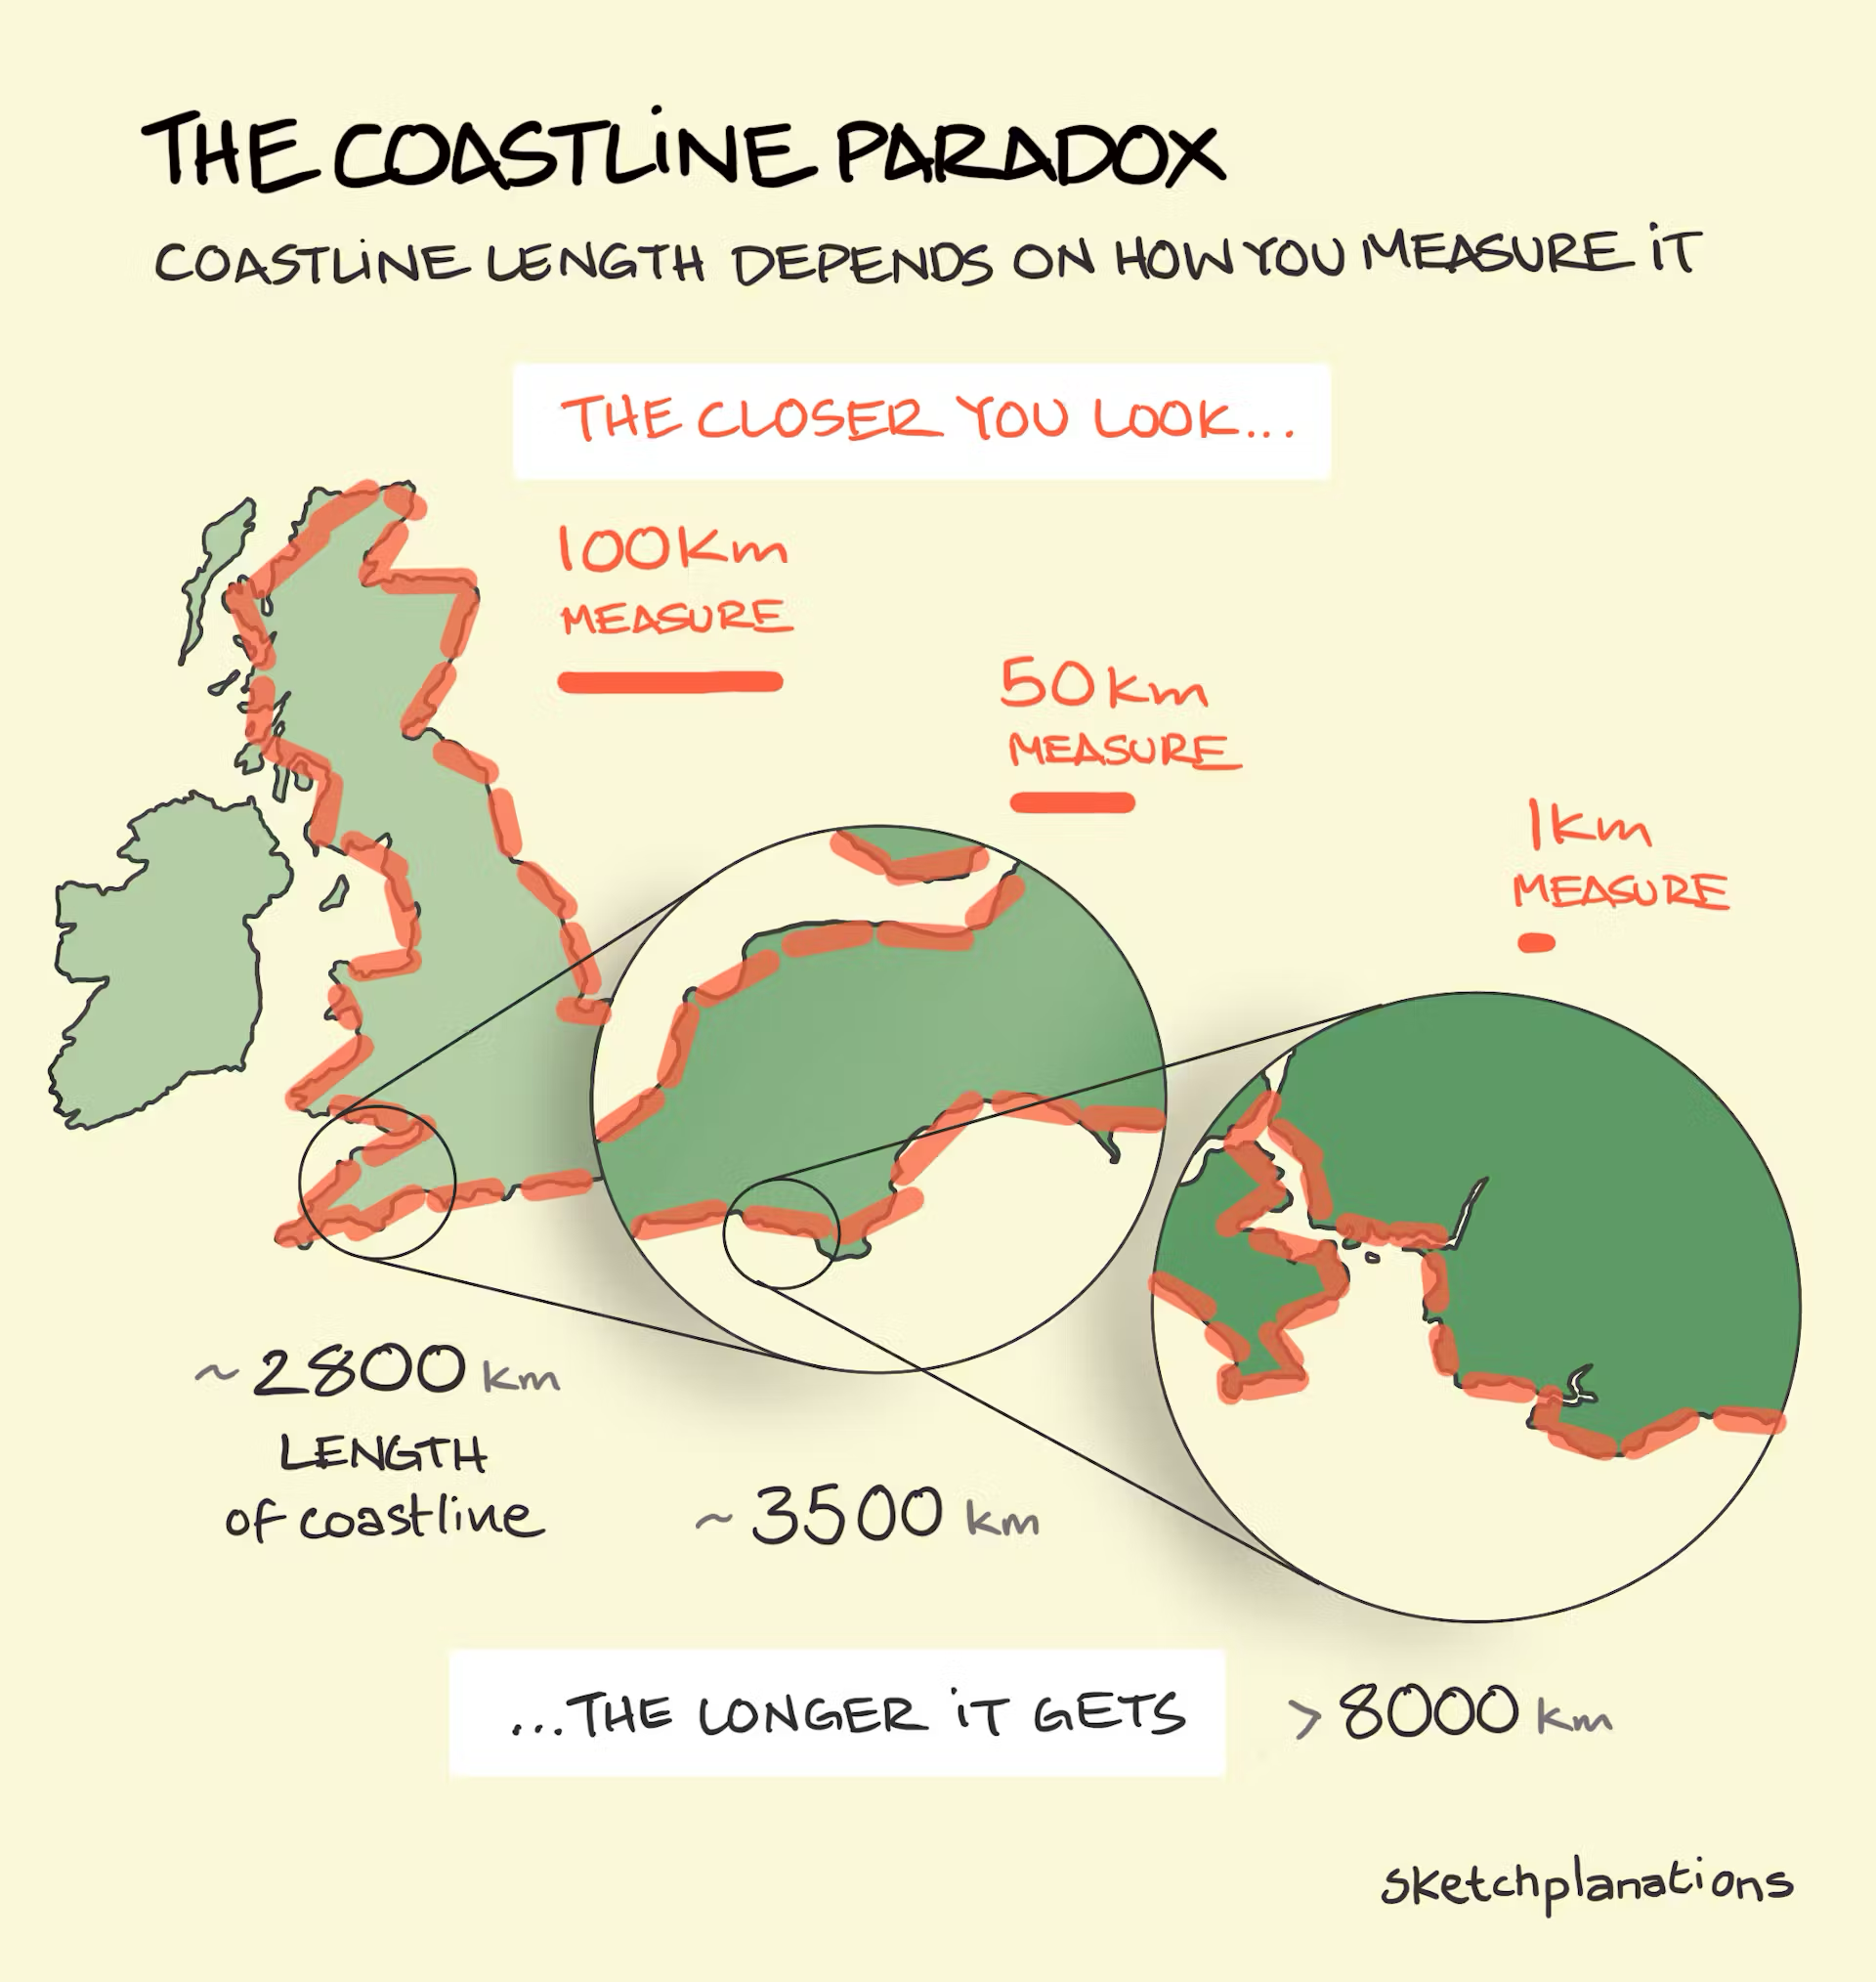 Image from (https://sketchplanations.com/the-coastline-paradox)
4.5 Why This Matters
Spatial data is special because:
- Location influences relationships between variables
- Scale changes the results of analysis
- Boundaries are often not fixed or clean
- Some processes cannot be meaningfully localized
- Patterns often repeat across scales (fractals)
In order to identify/predict the relationship between variables that have a spatial component, you need to use different, spatial regression models…